An impact report that brings the next gift.
Your year as an interactive report on your own site, with giving built in, plus a private Your Impact story for every donor and partner church. We build it, launch it, and stay with it.
Included in the Growth Team, or on its own. How pricing works
The next gift decides the year.
Fewer people are giving, and keeping the ones you have matters more every year. The annual report should help. Most of the time, it sits in an inbox.
- A PDF few people finishWeeks of work, skimmed in a minute, with no way to give.
- The same thanks for everyoneA first-time donor and a ten-year partner get the same letter.
- The next ask comes firstMany donors hear the next appeal before they see what their gift did.
Donors who give again the next year
New online donorsM+R Benchmarks 2026
All donorsFundraising Effectiveness Project, Q4 2025
Monthly donorsM+R Benchmarks 2026
Donors down 3.6%while revenue rose 5.0%. Fewer donors, giving more.Fundraising Effectiveness Project, Q4 2025
27% of online revenuecomes from monthly giving, which is why the report asks for it.M+R Benchmarks 2026
Your year, in front of every supporter.
The report
A report people finish
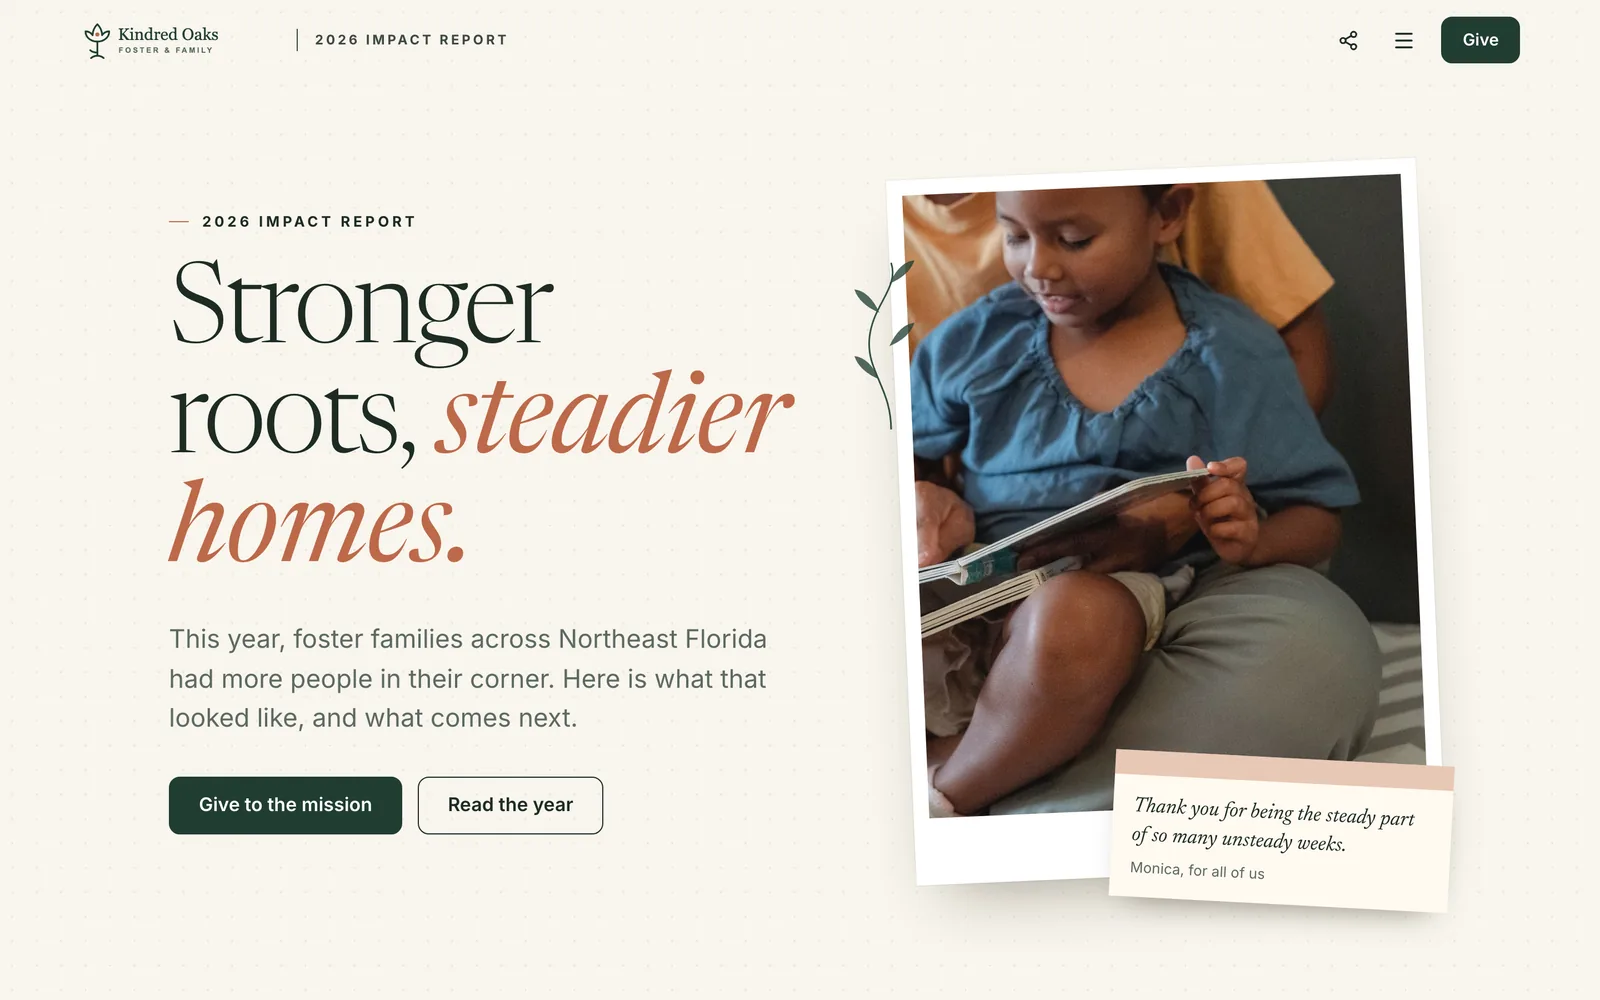
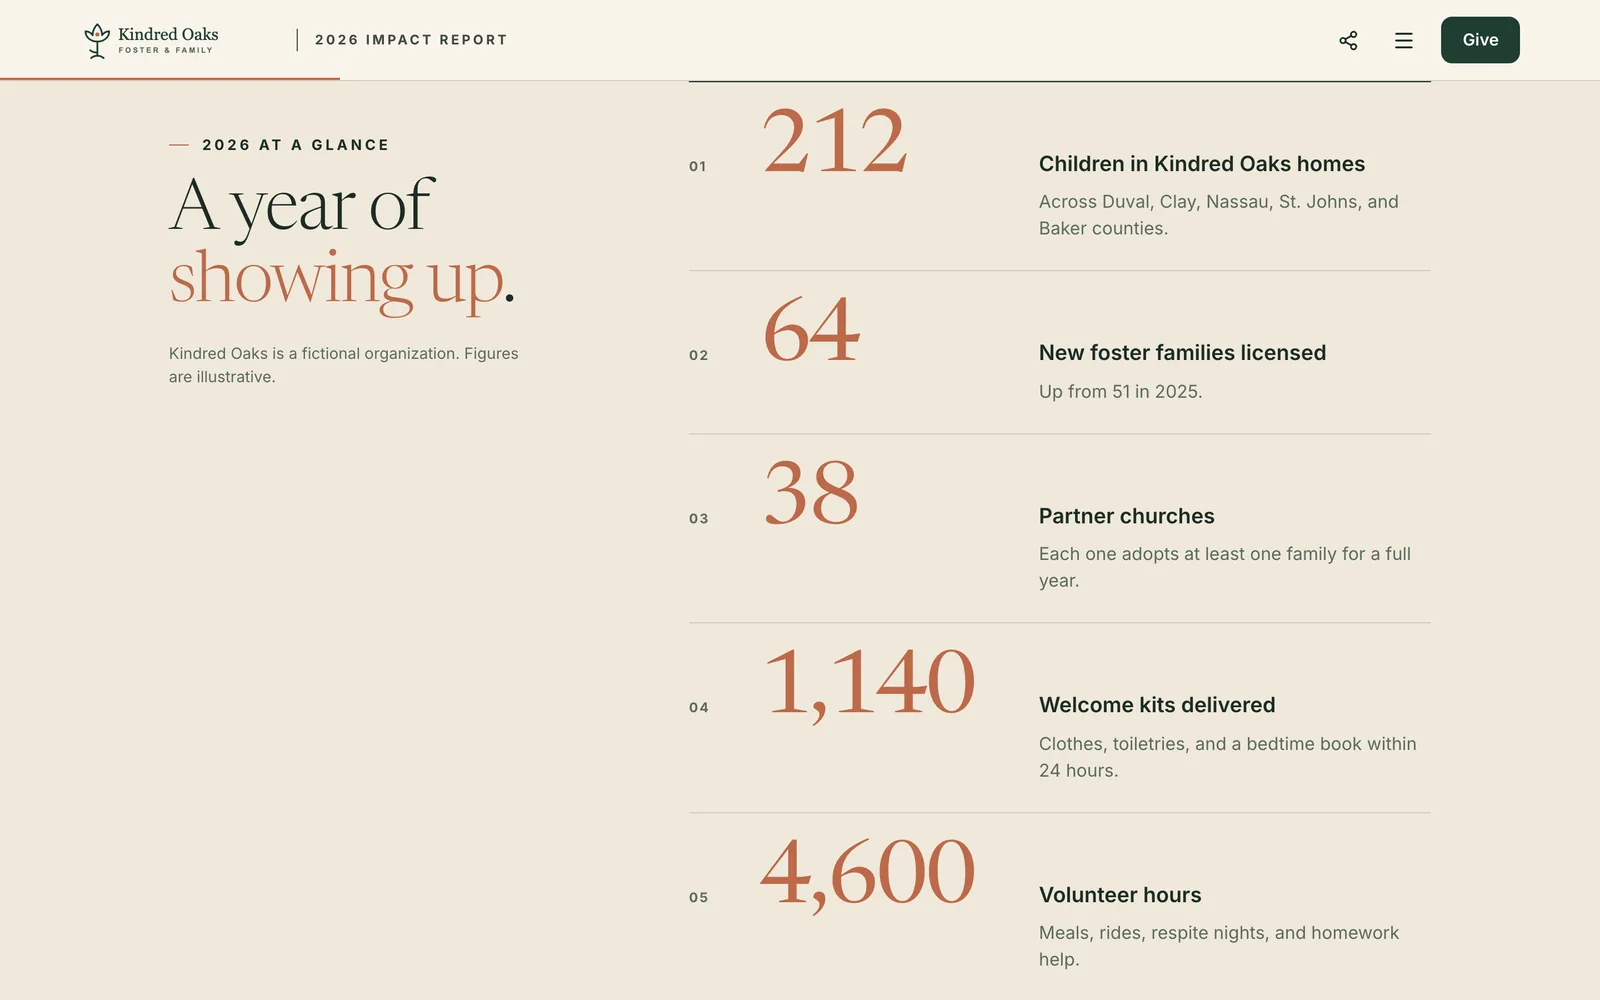
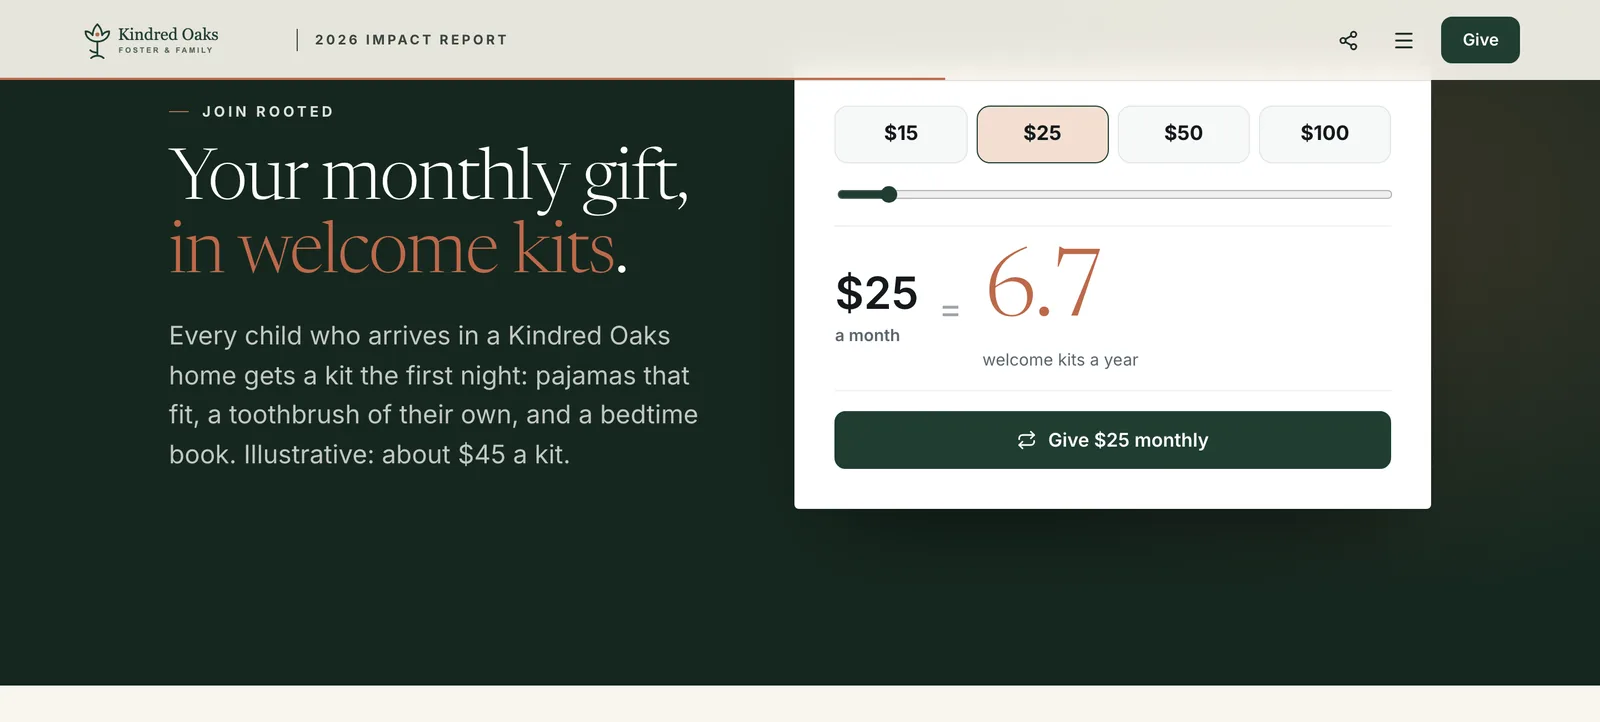
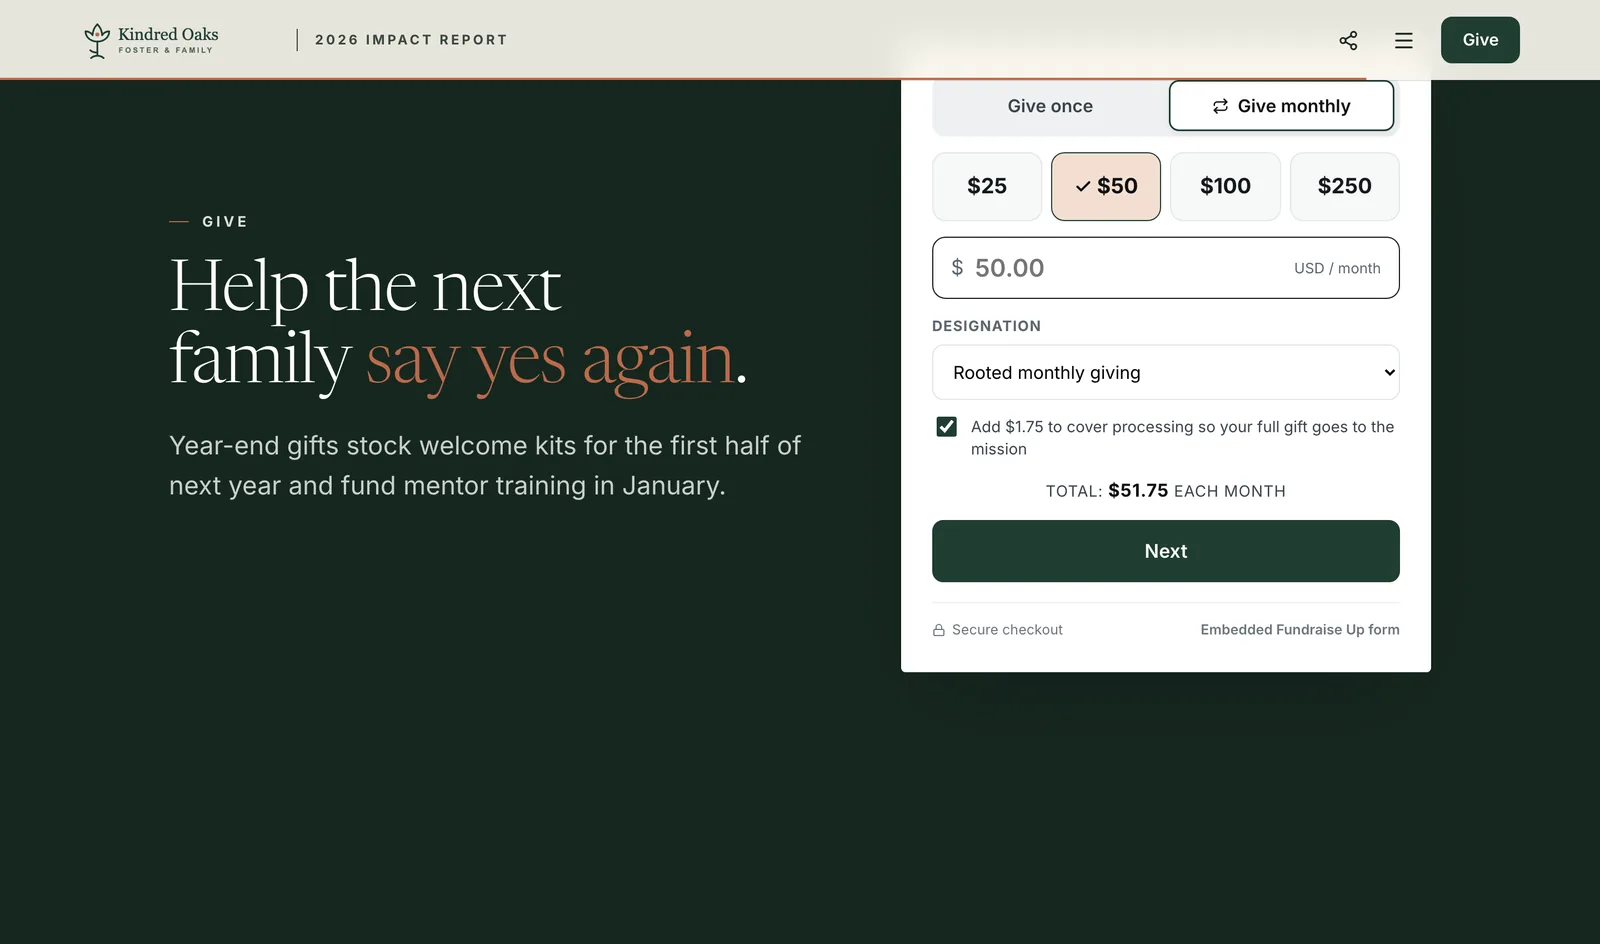
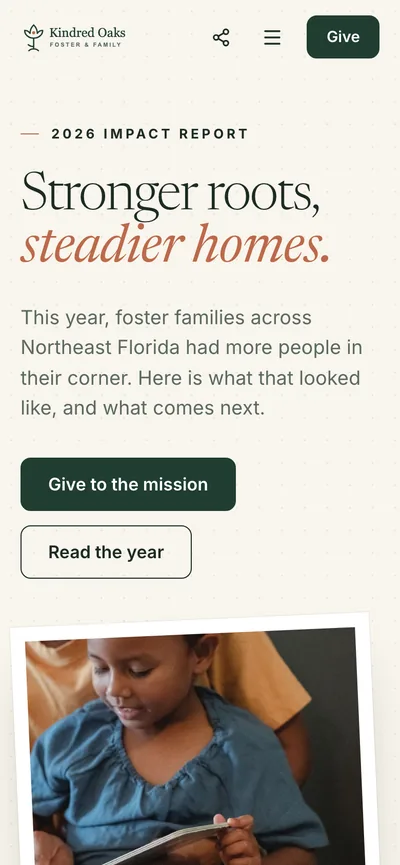
Your year as a short, interactive report on your own subdomain. Stories and a few numbers people remember, with giving built into the page instead of a link away.
- Your own subdomain
- Giving form built in
- Monthly upgrade ask
- Impact calculator
- Works on any phone
Your Impact
A story for every donor
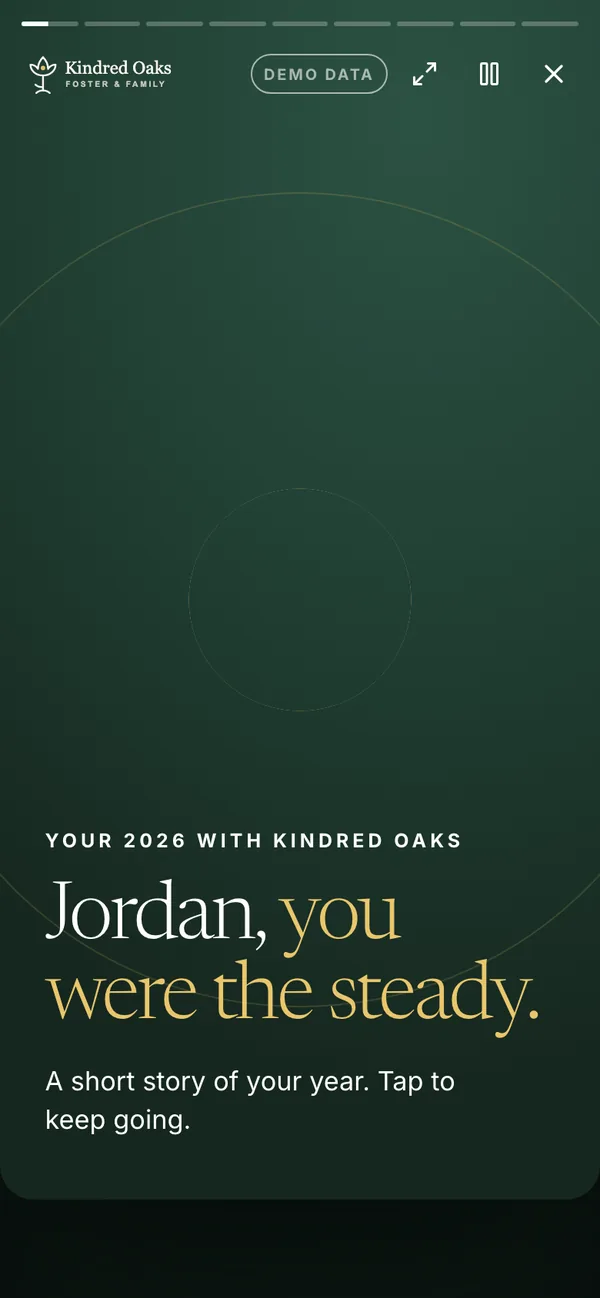
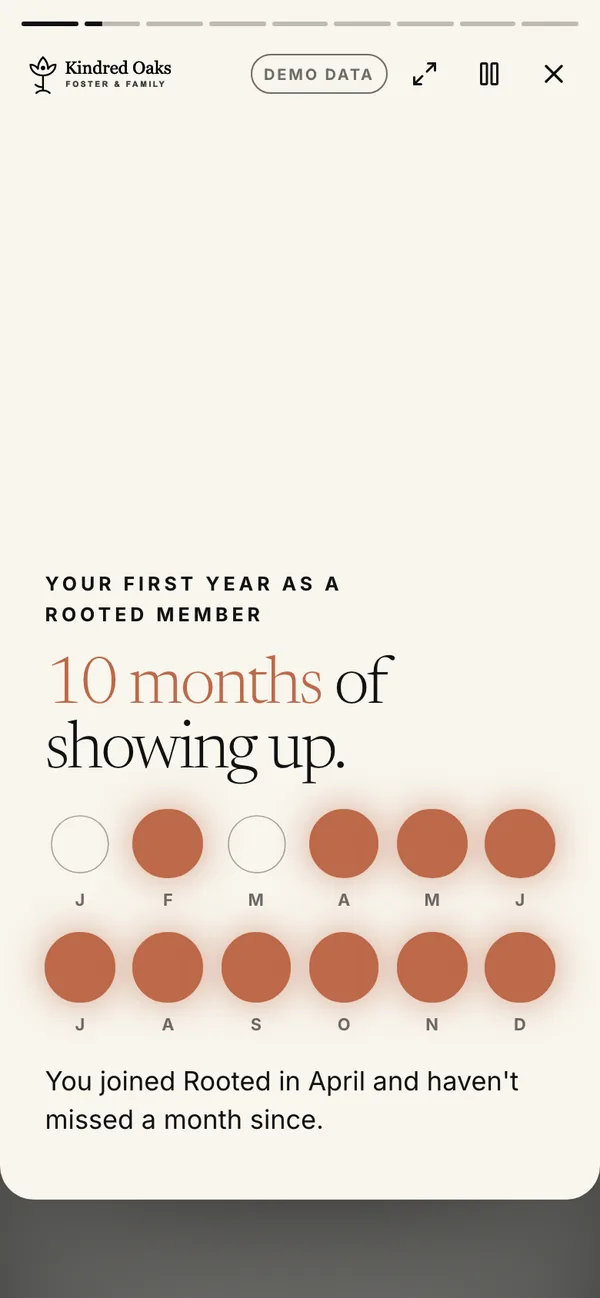
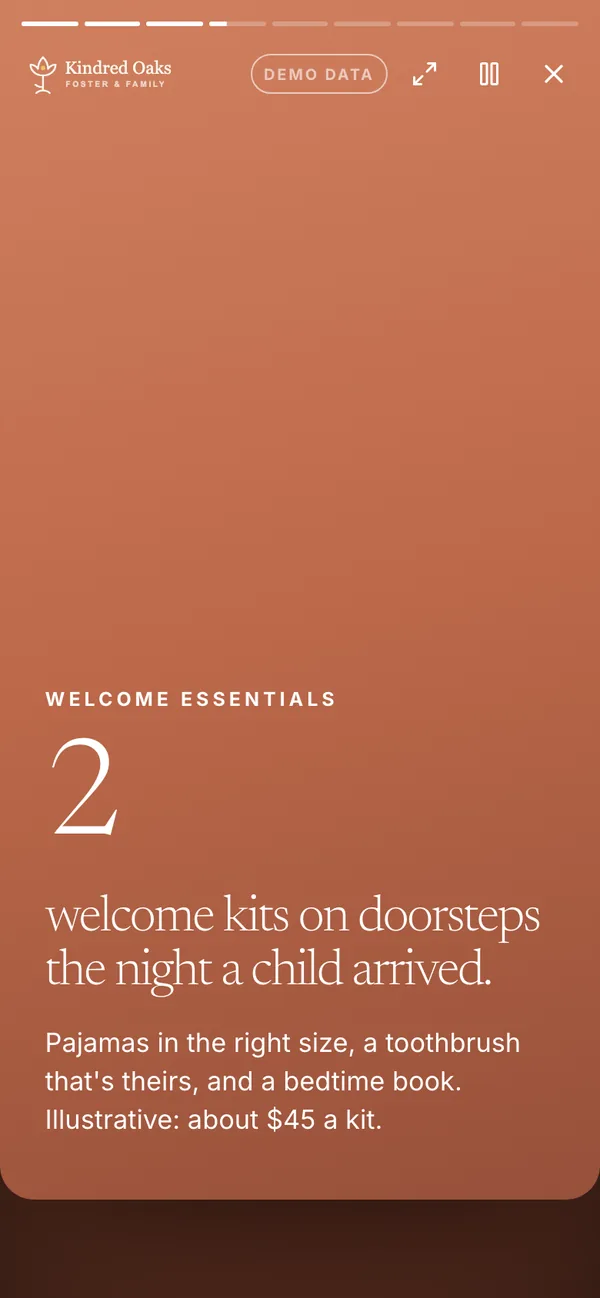
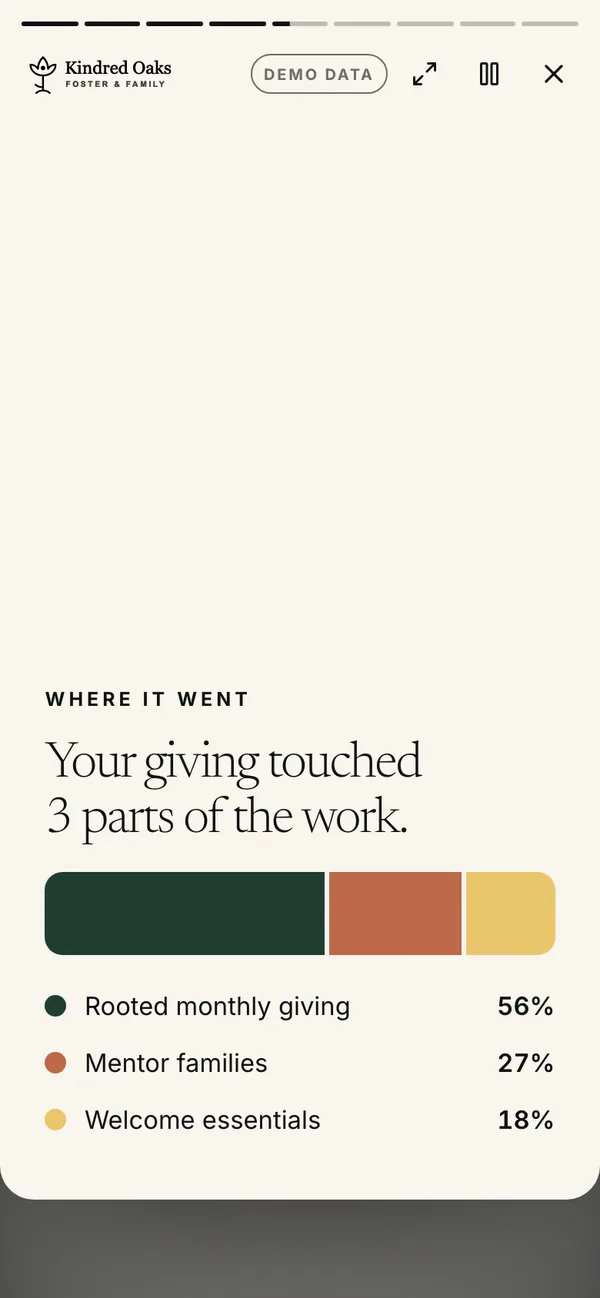
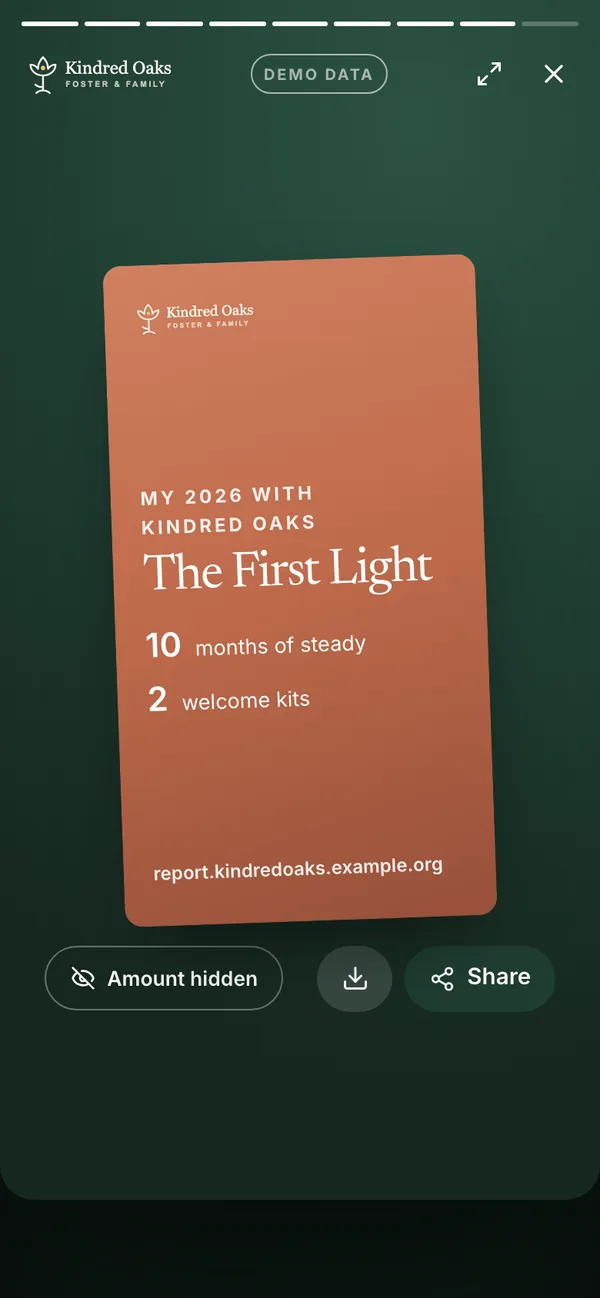
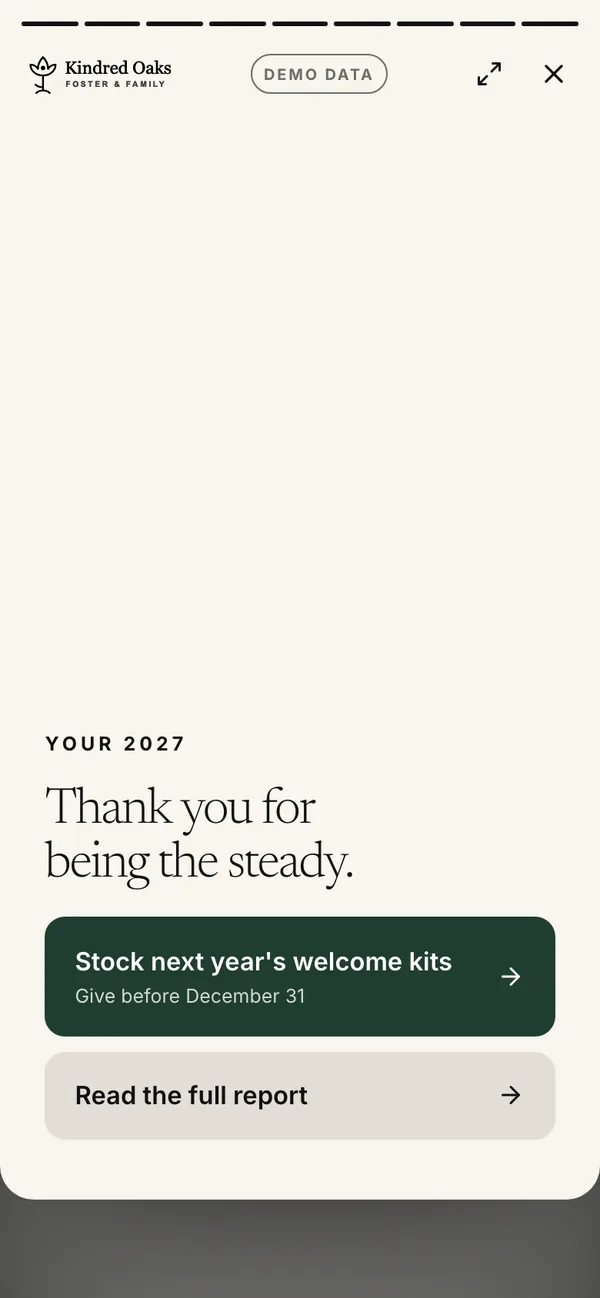
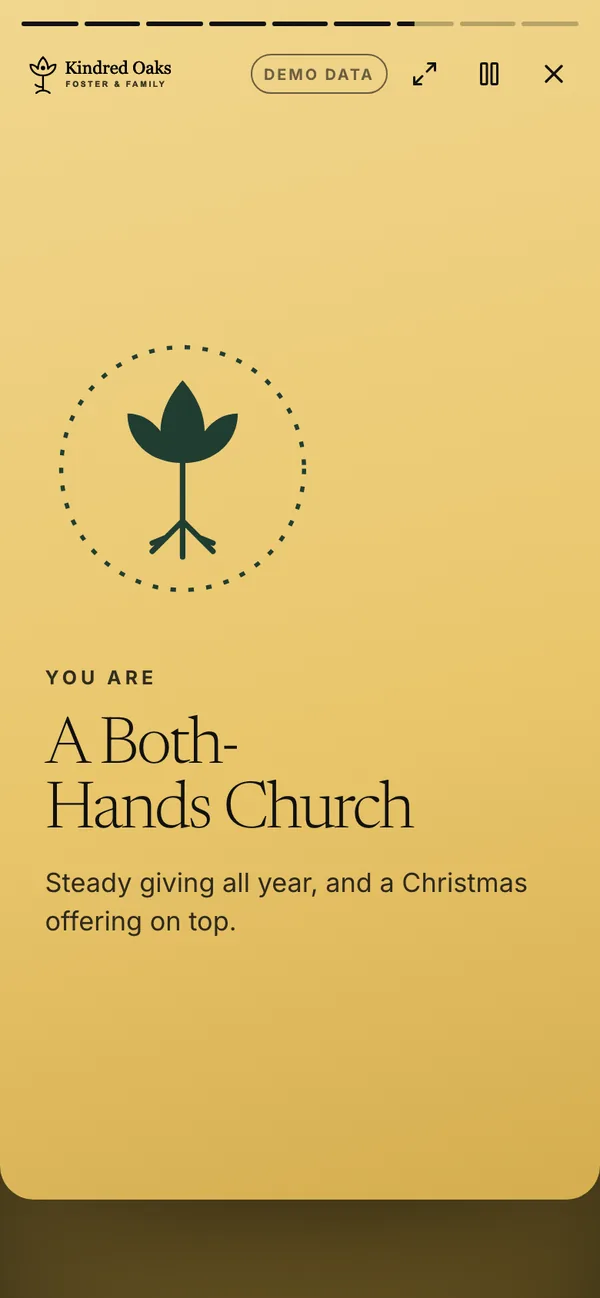
Each donor and partner church gets a short story of their own year, drawn from your CRM: how often they gave, what it made possible, and who they stood beside. Share cards hide the amount by default, and every story ends with one next step.
- A private link for each person
- Amounts hidden on share cards
- Donor and church versions
- One next step at the end
Share kit
Ready for every screen
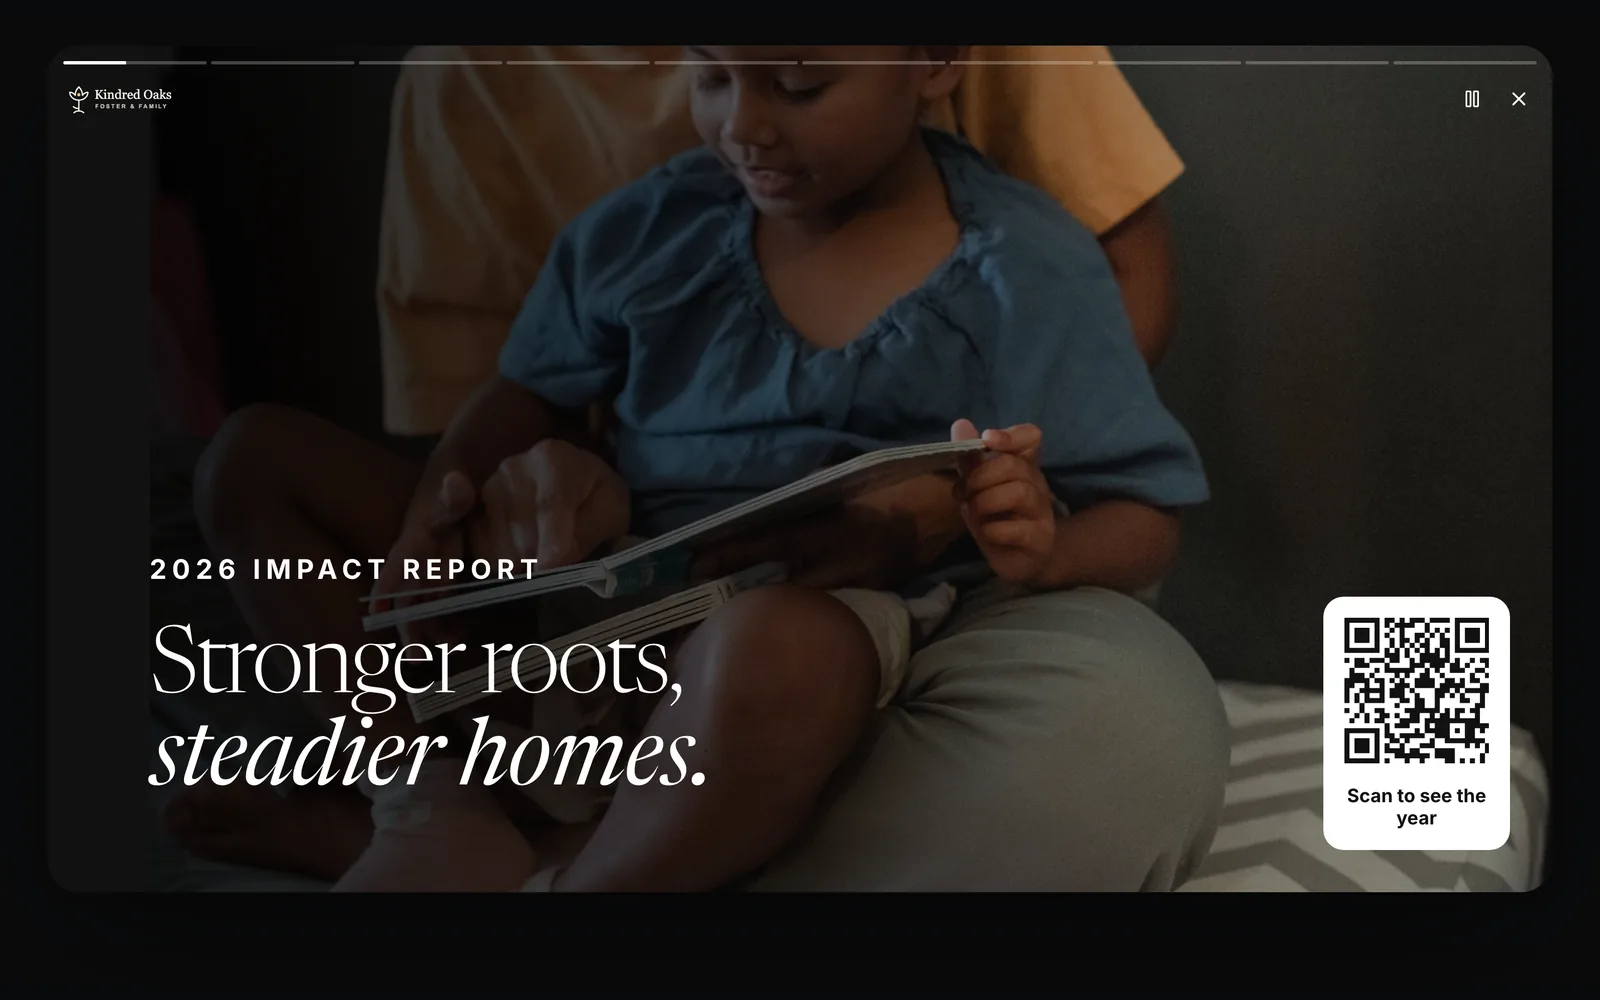
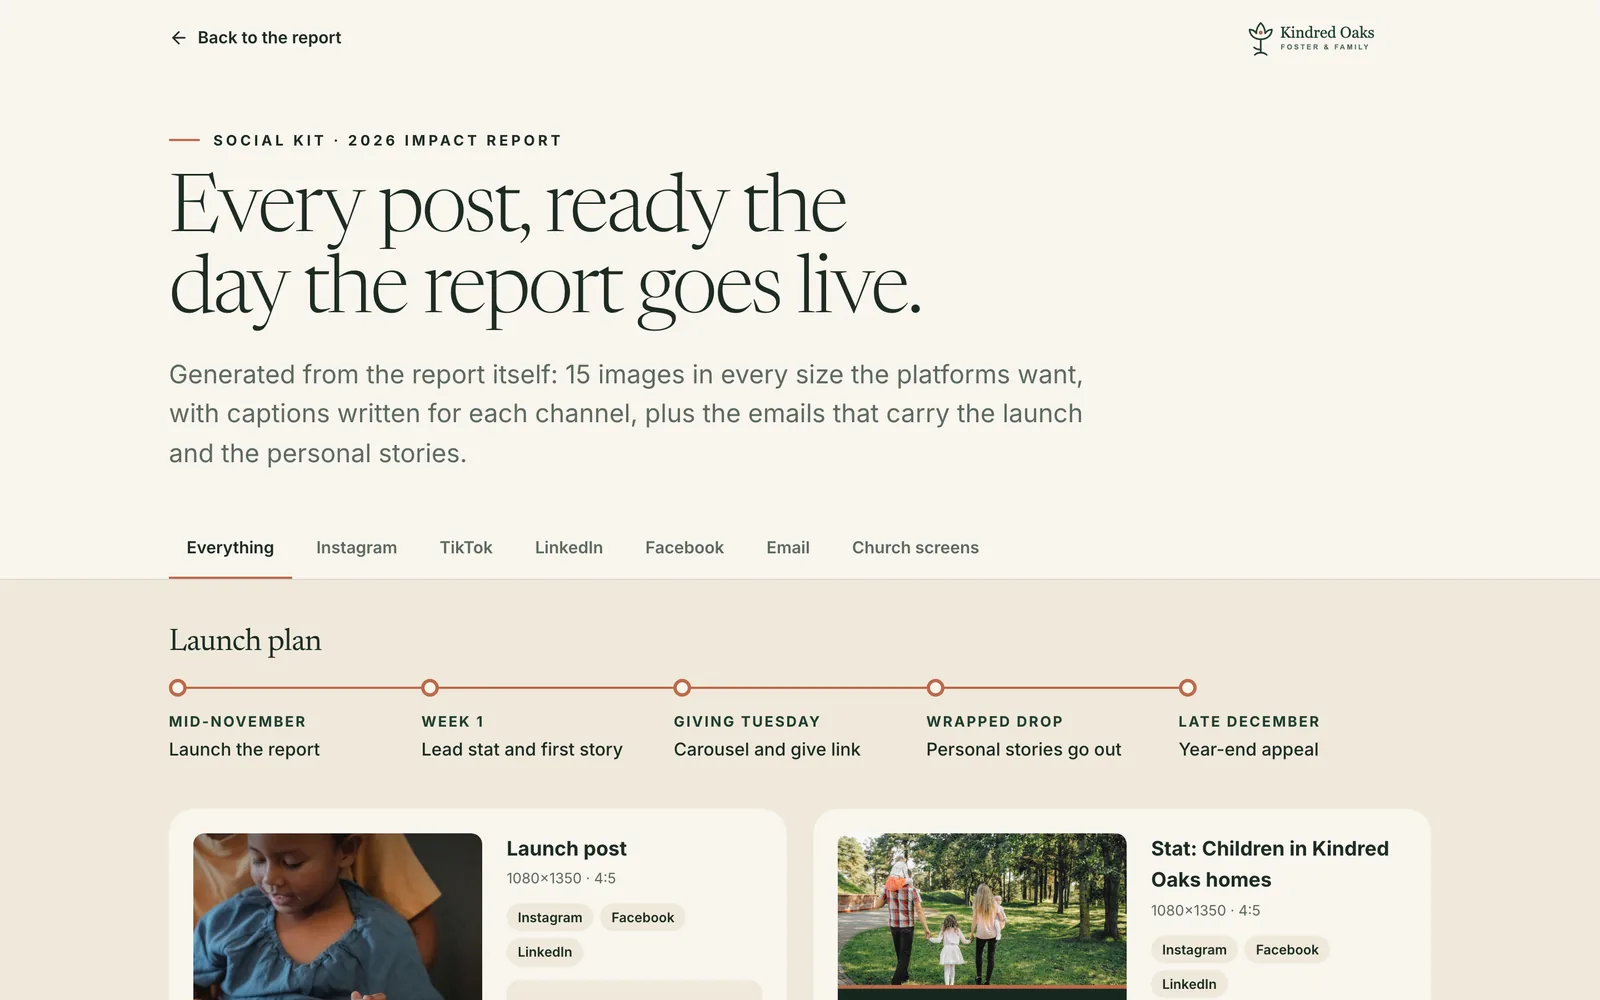
Posts and captions for each channel, short vertical reels, lobby and TV screens, and QR codes, all made from the report. Each QR code carries a source tag, so you can see which screen started the visit.
- Social posts and captions
- Animated reels
- Lobby and TV screens
- QR codes with source tags
- Launch emails
After the event
The morning after
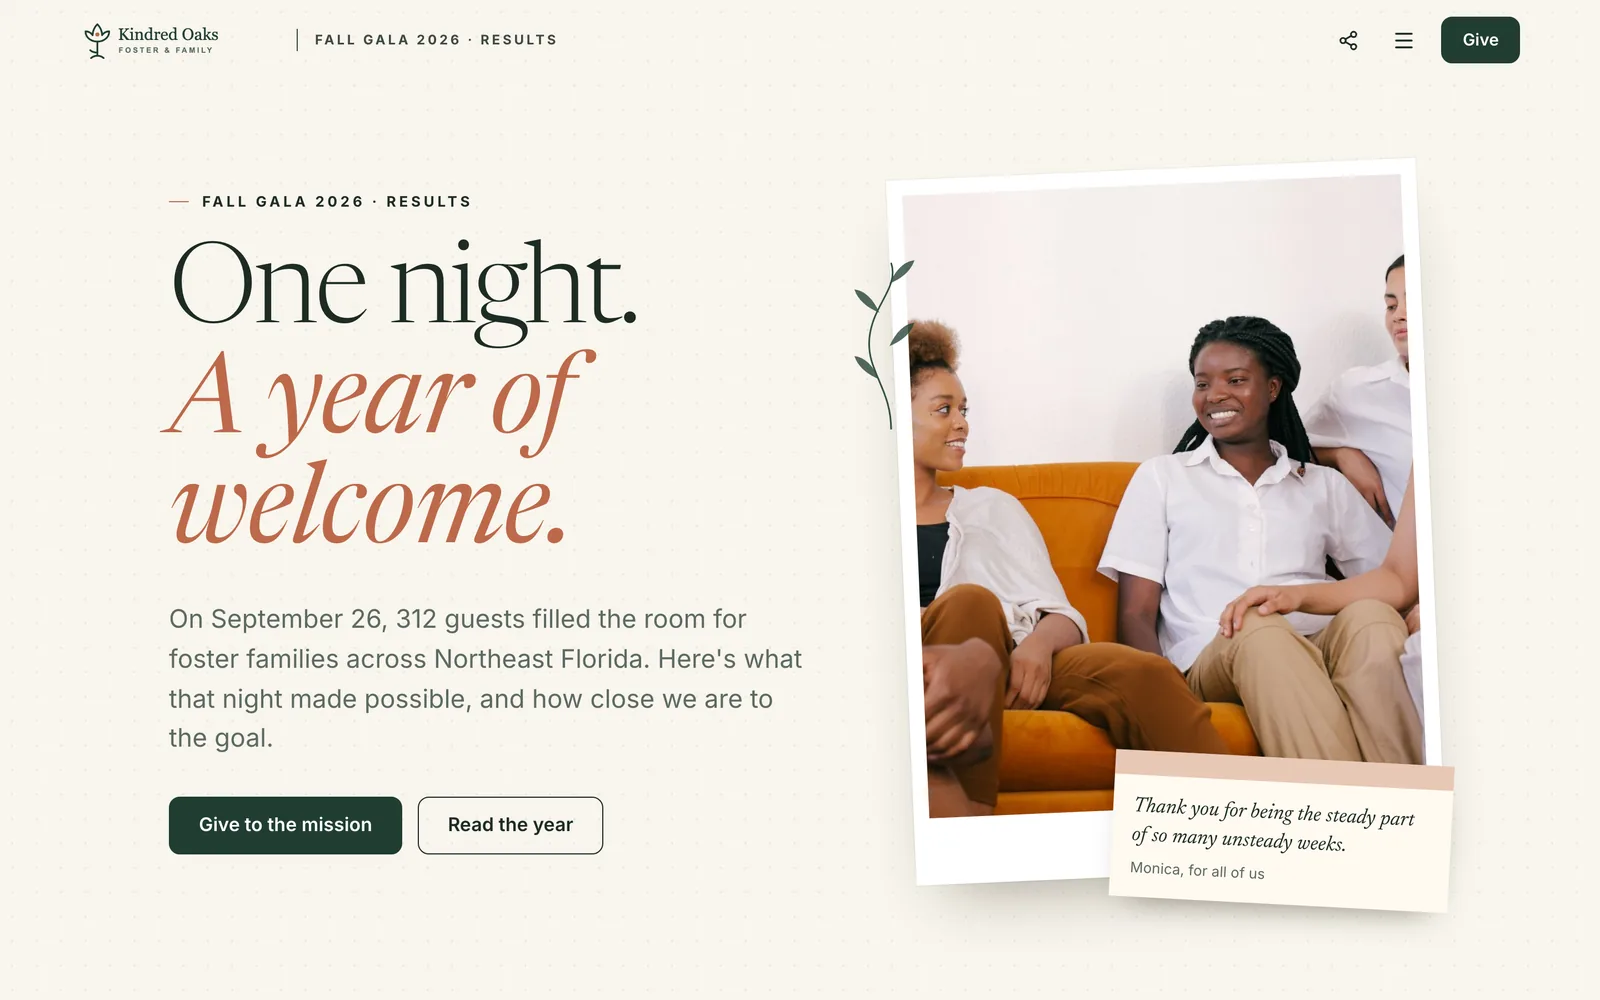
The same Build works as a post-event report. Guests see what the room did, how close you are to the goal, and a way to finish what the night started.
- What the night did
- A live goal bar
- Stories from the room
- Giving that stays open
From scattered evidence to a live report.
- IntakeYour website, every page, update feeds, documents and PDFs, call transcripts, social channels, and CRM project notes, gathered into one impact library.
- DesignYour brand tokens and story order set the look. Revision requests are tracked by section, so nothing gets lost between rounds.
- ConnectYour giving form, wired in. You choose who gets Your Impact: all donors, portfolios, segments, or a custom list, with the usage cost shown up front.
- DeployOn a subdomain, embedded in your current site, or on your own hosting.
- ShareSocial kit, reels, lobby and TV screens, and QR codes with source tags.
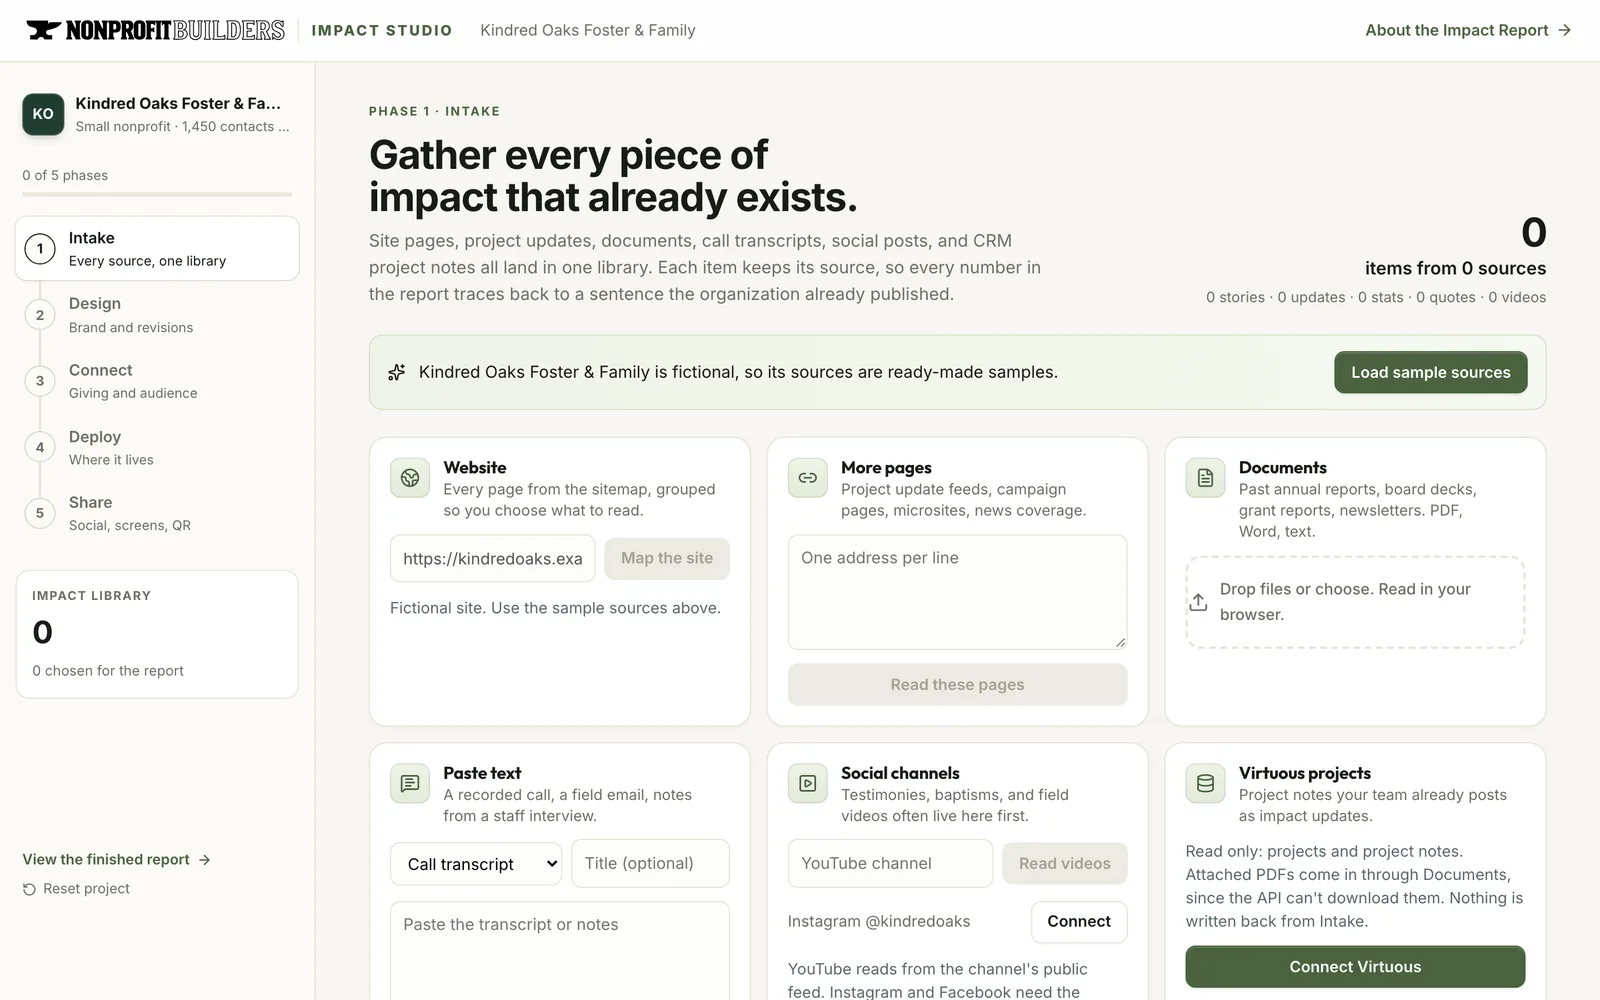
Every phase runs in one studio, and every number in the report traces back to a sentence you already published.
After launch, we stay with it. We watch the number with you, report what the year's story raised, and carry the template into next year.
For churches
Thank the churches beside you.
Partner churches see the year on their own screens, and each one gets its own story.
- Lobby and stage screensThe year on loop before and after services, with a QR code to the full report.
- A Sunday thank-you slideOne slide a partner church can show from the stage.
- Your Impact for churchesEach partner church gets its own story: the families it adopted and the people who showed up.
- Member generosityWhat the congregation's giving made possible, told back to the members who gave.
A church yourself? Ministry Builders, our sister brand for churches and ministries, builds this for congregations.

Questions nonprofit leaders ask.
Straight answers to what nonprofit leaders ask before they start.
Ask something elsePriced to your size.
You'll know the price before anything starts.
The report
Typically from
$7,500
- The interactive report on your subdomain
- Giving form, monthly ask, and impact calculator
- The share kit: social, reels, screens, and QR codes
- A results report after launch
Report + Your Impact
Typically from
$12,500
- Everything in the report
- Your Impact for donors and partner churches
- You choose who gets it, with the cost shown up front
- A next step in every story, tied to how they already give
Included in the Growth Team: a Build every quarter, kept running. See how.
Get a quote for your Impact Report.
Tell us a little about your organization. You'll have a scope and a price in writing before any work starts.
What we'll cover
- What you needThe problem, the people it serves, and the tools you use today.
- A clear scopeWhat we'd build, how long it takes, and what it costs.
- Your callGo ahead, change the scope, or wait. You decide.

You'll talk with Jason VanLueFormer VP of Product and Design at Virtuous